set.seed(7)
sample_means = replicate(10000, {
  x = rnorm (25, 0, 10)
  mean(x)
})The Sample Mean and Standard Error of the Sample Mean
statistics
The mean of a group of numbers gives information regarding their central location. The weight of any given value is proportional to the number of times that value appears relative to the number of observations. The general formula for the mean is given in (1) where \(x\) is a discreet random variable and \(n\) is the number of observations included in the estimate. We can see below that the mean of a group of numbers is a linear combination of their weighted values.
\[ \begin{equation} \mu = \frac{1}{n} \sum_{i=1}^n = \frac{1}{n} x_1 + \frac{1}{n} x_1 + \dots + \frac{1}{n} x_n \end{equation} \tag{1}\]
Sometimes you want to know the mean of a population but need to settle for the mean of a sample, a representative subset of the population. The sample mean provides a good (unbiased) estimate of the population mean, meaning it will tend to be accurate. However, the sample mean will not be identical to the population mean and may differ from sample to sample.
We can see this below, where we generate 10,000 samples of 25 observations each from a normal distribution with a mean of zero and a standard deviation of 10. We record the sample mean for each sample.
We can inspect the distribution of these sample means:
par (mar = c(4,4,1,1))
hist (sample_means, breaks=50, col=bmmb::cols[4],main='', xlab="Sample Mean")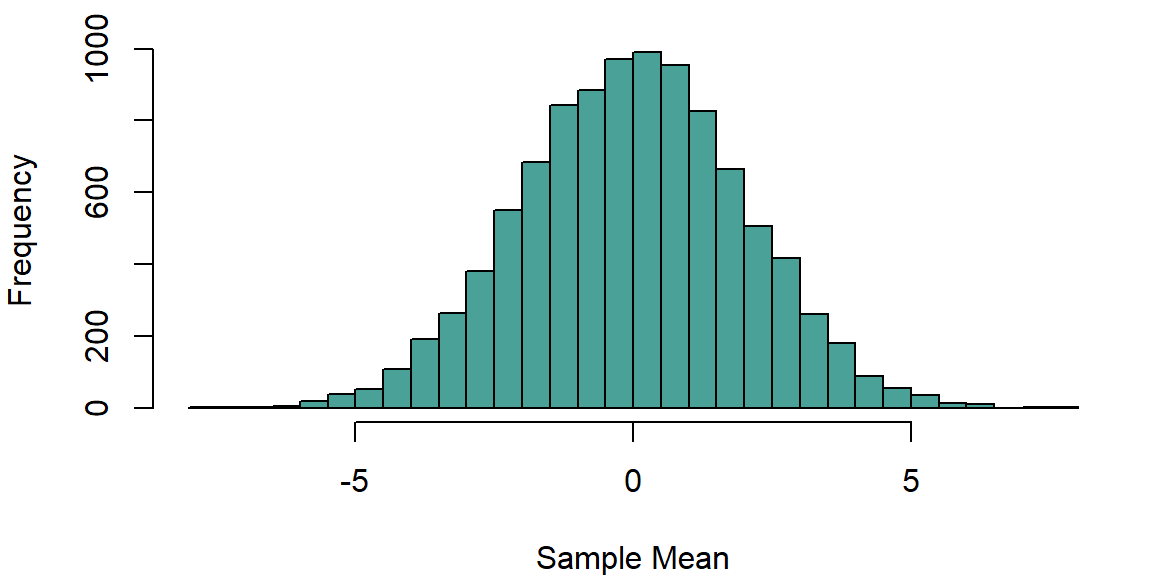
We can see in the histogram above that sample mean estimates appear to be approximately normally distributed. This is a result of the central limit theorem, which states that the distribution of the sample mean will tend to be normal as the sample size increases. This is true for a wide range of probability distributions, not just for normally distributed data.
The expected value of the sample mean is equal to the population mean (this is what it means that the sample mean is an unbiased estimator). In other words, we expect that the mean of distribution of sample means will be equal to the population mean, in this case zero. Can we say something about the expected variation in sample means, the standard error of the sample mean? It turns out that yes, we can, and that this variation is fairly predictable from the sample size and sample variance.
According to the Bienaymé’s identity formula, the variance of the sum of uncorrelated random variables is equal to the sum the individual variables. For example:
\[ Var \left( \sum_{i=1}^n x_i \right) = Var(x_1) +Var(x_2) + \dots + Var(x_n) = \sum_{i=1}^n Var (x_i) \tag{2}\]
Most traditional statistical models assume that observations are uncorrelated, so we can apply this approach to finding the variance of the mean. This is shown in (3) where we see that the variance of the sample mean is equal to the sum of the variance of \(x\) times \(1/n\), for all the observations in the sample.
\[ \sigma^2_{\mu_x} = Var(\mu_x) = Var \left( \frac{1}{n} x_2 \right) + \dots + Var \left( \frac{1}{n} x_n \right) = \sum_{i=1}^n Var \left( \frac{1}{n} x_i \right) \tag{3}\]
When trying to determine the variance of a variable \(x\) multiplied by a constant \(\mathrm{c}\), the following relation holds: \(Var(\mathrm{c}x) = \mathrm{c}^2\, Var(x)\). This means we can ‘pull’ the 1/n out of the variance function and equation (4) can be re-written as:
\[ \begin{equation} \sigma^2_{\mu_x}= \sum_{i=1}^n \frac{1}{n^2} Var \left( x_i \right) \end{equation} \tag{4}\]
Each term in equation (3) should be thought of as relating to the variance of a single observation in a certain position in a string of observations. Since the variance of every observation will be the same if they all come from the same population (and each observation is independent), the variance of each term will be the same. Additionally, the number of terms does not affect the variance of any individual term. The result of this is that the variance of each term will be equal to the population variance and as a result, equation (3) can be further simplified as in equation (4):
\[ \begin{equation} \sigma^2_{\mu_x} = \sum_{i=1}^n \frac{1}{n^2} \sigma^2_x \end{equation} \tag{5}\]
Since we are summing the same thing \(n\) times above, let’s just multiply by \(n\) instead. We do this below, and simplify to arrive at our answer: the variance of the sample mean is equal to the variance of the variable divided by \(n\) (the sample size).
\[ \begin{equation} \sigma^2_{\mu_x} = n \left( \frac{1}{n^2} \sigma^2_x \right) = \frac{n}{n^2} \sigma^2_x = \frac{\sigma^2_x}{n} \end{equation} \tag{6}\]
To find the standard error (a.k.a. standard deviation) of the sample mean, you find the square root of the variance, as in (7). \[ \sqrt{\sigma^2_{\mu_x}} = \sqrt{\frac{\sigma^2_x}{n}} = \frac{\sigma_x}{\sqrt{n}} \tag{7}\]
The standard error of the sample mean is a measure of the amount of variability that can be expected in a sample of a given size from a certain population. It serves as the denominator in t-tests and its square is the denominator in a one-way analysis of variance. Effectively, the standard error of the sample mean is a measure of the precision of the sample mean as an estimate of the population mean. It is inversely proportional to the square root of the sample size, so that the standard error of the sample mean decreases as the sample size increases.
We can return to the sample means simulated above and find the mean and standard deviation of the estimates. We can see below that the mean of the sample means (-0.0148) is pretty close to the population mean (0), and the standard deviation of the sample means (1.9951) is close to the population standard deviation divided by the square root of the sample size (\(\sigma^2/n = 10/5 = 2\)).
mean (sample_means)
## [1] -0.01475115

sd (sample_means)
## [1] 1.995108
par (mar = c(4,4,1,1))
uniform_data = runif (5000, 0, 1)
hist (uniform_data, breaks=50, col=bmmb::cols[1],main='', xlab="Sample Mean")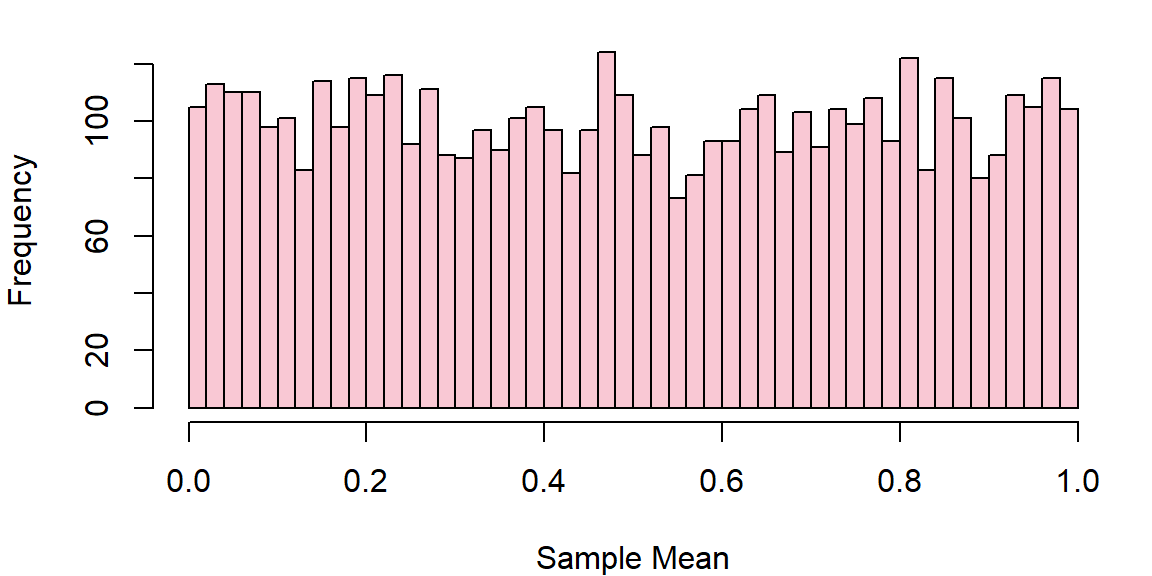
A uniform distribution spanning from \(a\) to \(b\) has an expected mean equal to \((a+b)/2\) and variance equal to \(\frac{1}{12}(b-a)^2\). This means our distribution has mean of 0.5 and a variance 1/12. We can generate 10,000 samples from this distribution and record the sample mean each time.
set.seed(7)
sample_means_uniform = replicate(10000, {
  x = runif (25, 0, 1)
  mean(x)
})
We can inspect the distribution of these sample means and see that it is approximately normal even though the underlying data is not.
par (mar = c(4,4,1,1))
hist (sample_means_uniform, breaks=50, col=bmmb::cols[3],main='', xlab="Sample Mean")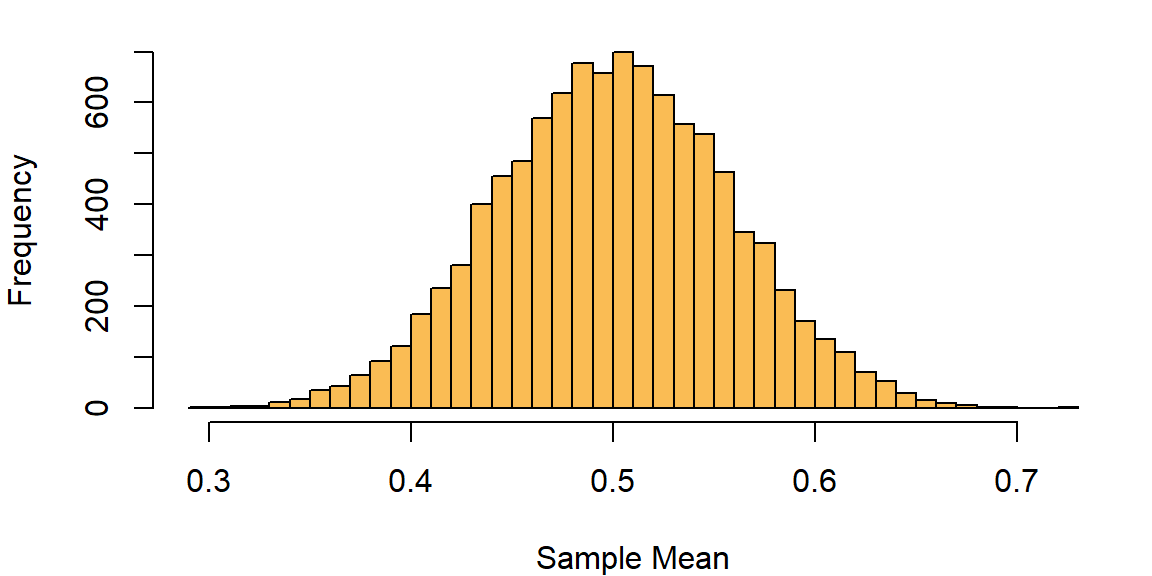
Since the variance is 1/12 and we have 25 observations, the variance of the sample mean should be:
\[ \left( \frac{1}{12} \right) \cdot \left( \frac{1}{25} \right) = 1/300 = 0.0033 \]
And the standard error should be:
\[ \left( \frac{1}{\sqrt{12}} \right) \cdot \left( \frac{1}{\sqrt{25}} \right) = 0.05773503 \]
We can see that this is a good match for our simulated data:
sd (sample_means_uniform)
## [1] 0.05739527